
On 19 August, ZIM published Q2 2026 earnings showing net income of $64 million and diluted EPS of $0.53. Several pre-release analyst estimates had still pointed to a quarterly loss. Adjusted EBITDA reached $491 million. By conventional metrics, this was a strong earnings beat.
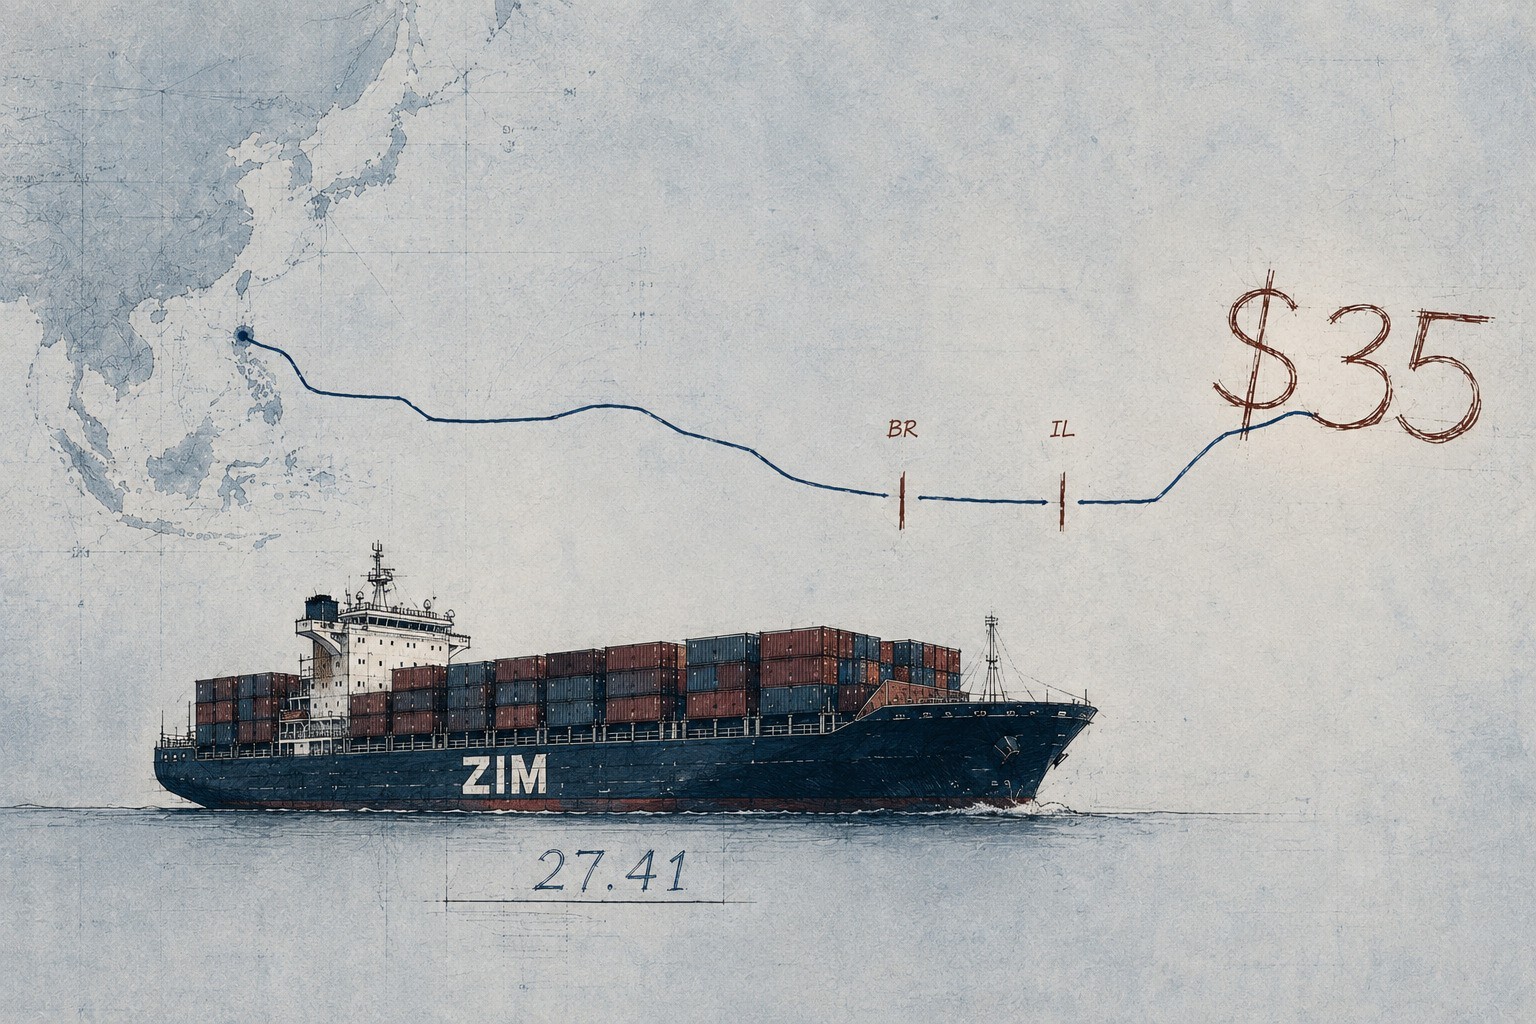
The stock closed at $27.41 on 19 August, down 3.8% from the prior session and trading roughly 21.7% below the $35 per share all-cash offer announced by Hapag-Lloyd on 16 February 2026.
That discount persisted despite the earnings surprise. This is not unusual in itself. Deal spreads widen and narrow constantly. The anomaly here runs deeper. The market is effectively being asked to price ZIM as two securities at once: a cyclical container carrier whose earnings fluctuate sharply with freight rates, and a conditional claim on a $35 cash payment whose value depends on the transaction clearing an increasingly complicated regulatory process.
The discount can therefore no longer be read cleanly as a proxy for deal probability. It also contains the market’s judgment on another variable: how much of ZIM’s Q2 earnings power survives if the transaction does not close.
That question is precisely what separates the operational strength ZIM demonstrated in Q2 from the increasingly complicated regulatory process now unfolding in Brazil and Israel. The more uncertain the assumptions around the company’s standalone earnings become, the less informative a simple merger spread becomes about what the market is actually pricing.
The framework still works. The trouble is that its break price refuses to sit still. As a result, any deal probability inferred from the spread becomes highly sensitive to the standalone-value assumption.
Operating ZIM: what happens when rates meet leverage
The scale of ZIM’s operating leverage became much harder to miss in Q2. In the first quarter of 2026, the carrier moved 866,000 TEU at an average freight rate of $1,310 per TEU, generating adjusted EBITDA of $313 million and recording a net loss of $86 million. Three months later, Q2 volume reached 922,000 TEU, 6.5% higher sequentially, while the average freight rate climbed 21.4% to $1,590 per TEU. Adjusted EBITDA rose 57% to $491 million. The bottom line improved by $150 million, from an $86 million loss to a $64 million profit.
Freight rates did not produce that reversal alone. Costs, trade mix and other operating variables also changed between quarters. Yet the asymmetry resists easy dismissal: volume increased 6.5% sequentially, the average realized rate rose 21.4%, and adjusted EBITDA increased 57%. The comparison does not isolate freight rates from every other variable, but it shows how rapidly ZIM’s earnings respond when pricing improves far faster than volumes. What distinguishes ZIM in Q2 is where that sensitivity was concentrated. The trade-level numbers make the answer rather less mysterious.
The Transpacific test: where the leverage sits
Volume growth was anything but uniform across the network. In Q2 2026, ZIM carried 426,000 TEU in the Pacific trade, up 20.3% from 354,000 a year earlier. Total company volume, by contrast, increased only 3.0% year on year. Cross-Suez volumes fell 13.2%, Atlantic declined 8.5%, and Latin America dropped 27.0%, while Intra-Asia rose 6.5%.
The arithmetic is revealing. Pacific volumes increased by 72,000 TEU year on year, while ZIM’s total carried volume increased by only 27,000 TEU. Growth in the Pacific therefore did more than lead the network. It offset contractions elsewhere, concentrating the company’s volume growth in a single trade that was moving far more strongly than most of the rest of the network. Pacific volume accounted for 46.2% of ZIM’s quarterly total.
ZIM entered Q2 with substantial Transpacific capacity already in place. At the end of 2025, the carrier operated eight services across its Pacific geographic trade zone, representing effective weekly capacity of approximately 31,333 TEU. On the Pacific Southwest, its ZEX and ZX2 express services connected China and Vietnam with Los Angeles. Farther east, ZIM’s strategic cooperation with MSC covers the Asia–U.S. East Coast and Gulf trades. Under that arrangement, ZIM deployed ten 15,000 TEU LNG dual-fuel vessels and eleven 8,000-class TEU LNG vessels on ZIM-operated services. The exposure visible in Q2 therefore rested on network architecture and modern tonnage that predated the quarter.
Rates return, but what is holding them up?
Volume, however, answers only half the question. The durability of ZIM’s Q2 earnings power also depends on the pricing environment in the trade where its volume growth was concentrated. That makes Transpacific rates the next test. On 20 August, Drewry’s World Container Index rose 4% to $4,526 per 40ft container, its third consecutive weekly increase. More importantly for ZIM’s exposure, Shanghai–Los Angeles and Shanghai–New York spot rates both climbed 9%, to $6,802 and $9,507 per 40ft container respectively.
That looks like confirmation of Transpacific strength. It is not yet confirmation of its durability. Drewry describes demand on the trade as resilient, but the same assessment shows carriers actively managing supply. Seven blank sailings were announced for the following week, while August capacity fell 9% month on month from Asia to the U.S. East Coast and 0.4% to the West Coast. The disparity between those two capacity reductions is considerable, but the direction is the same: neither trade received additional capacity as spot rates strengthened.
The distinction matters. Strong demand can support pricing through cargo growth; supply discipline can support it by limiting available slots. The current evidence points to both forces operating at once: Drewry reports resilient Transpacific demand while carriers continue to use blank sailings and capacity reductions. For ZIM, therefore, the sustainability of the pricing environment matters more than any single weekly increase. Whether Q2 earnings power proves repeatable will depend partly on how that combination of demand, capacity and freight rates develops.
The regulatory clock no longer matches the deal clock
The transaction now faces a regulatory timetable that is becoming harder to reconcile with the companies’ stated closing target. In Brazil, CADE has moved the transaction into a full-form review, according to MLex, after competition concerns emerged on three long-haul liner routes involving the east coast of South America. A full-form review removes the transaction from the simplified timetable that might otherwise have applied. Meanwhile, Hapag-Lloyd’s H1 2026 Investor Report continues to present completion as subject to regulatory approval while maintaining its year-end 2026 timetable.
Israel presents a different problem. The state’s Special State Share gives the Israeli approval process strategic significance beyond conventional merger control. Opposition has also widened. On 28 May, CTech reported that the Economy and Agriculture ministries had joined objections already raised by the Shipping and Ports Authority. On 5 July, the Defense Ministry formally joined the opposition, saying that the proposed sale did not adequately safeguard Israel’s security interests. The sequence matters more than an unofficial tally: opposition now spans government bodies concerned with transport, economic resilience, food supply and national security.
That is not the same as a veto. No formal exercise of Israel’s Special State Share blocking the transaction has been announced, and completion remains subject to the required regulatory approvals. The distinction matters because the deal remains alive; what has changed is the difficulty of reconciling its corporate timetable with two increasingly demanding approval processes. Brazil has moved beyond a simplified review, while Israeli opposition has broadened across several government bodies. Hapag-Lloyd can still target completion by year-end. The evidence no longer makes that timetable look routine.
The valuation paradox: what exactly is $27.41 pricing?
The 21.7% discount to Hapag-Lloyd’s offer looks straightforward only if ZIM has a reasonably stable value without the transaction. The merger documents suggest otherwise. In the March 2026 proxy statement, Evercore applied a 3.5x to 5.5x TEV/2026E EBITDA range in its selected-public-companies analysis, producing implied equity values of $23.70 to $49.84 per ZIM share. Barclays used a narrower 4.1x to 5.1x EV/2026E EBITDA range and arrived at $32.10 to $44.01. The same advisers produced materially different results using discounted cash flow: Evercore calculated $19.27 to $40.85 per share, while Barclays arrived at $14.19 to $21.24. These were reference ranges generated by different methodologies, not competing declarations of ZIM’s intrinsic value. Yet their breadth illustrates the problem facing anyone trying to infer a clean break price from the current share price.
There is another complication. Those analyses relied on management projections prepared on a standalone basis that assumed 2026 adjusted EBITDA of $1.574 billion. Five months later, ZIM’s Q2 guidance put full-year adjusted EBITDA at $2.0 billion to $2.4 billion, 27% to 52% above the forecast used in the February valuation work. That does not mean the old fairness ranges can simply be marked upward. The comparable-company analyses depended on multiples, balance-sheet adjustments and other inputs, while the DCF analyses depended on multi-year cash flows, discount rates and terminal assumptions. It does mean that the earnings assumption underlying those February valuations has already become materially outdated.
That leaves $27.41 in an unusually ambiguous position. It sits inside Evercore’s $23.70 to $49.84 comparable-company range, below Barclays’ $32.10 to $44.01 equivalent range, inside Evercore’s $19.27 to $40.85 DCF range and above Barclays’ $14.19 to $21.24 DCF range. Therefore, converting the $7.59 spread to the $35 offer into a single implied probability of completion would create precision where none exists. The usual merger-arbitrage equation requires an assumed break price. With ZIM, that assumption is precisely what remains unstable. The market is not merely pricing whether Hapag-Lloyd gets the deal through. It is also pricing what ZIM might be worth if it does not.
What remains to be discovered
The operating leverage was unmistakable in Q2. The regulatory obstacles are visible. The valuation ranges are on the table. What remains unresolved is which uncertainty will ultimately dominate the price. Transpacific rates will test how much of ZIM’s recovered earnings power can survive into the second half. Brazil and Israel will determine whether shareholders ever receive the $35 consideration.
Until those questions begin to resolve, ZIM remains precisely what the $27.41 price suggests: a company caught between an uncertain standalone value and an uncertain transaction outcome. Better freight markets can raise the value of the former. Regulatory resistance can reduce the probability of the latter. And weaker rates can reverse the standalone argument with considerable speed.
The market is pricing both uncertainties at once. It has resolved neither.